Benchmarks
I built moraine to be faster than the two obvious alternatives, Lance and Delta Lake, on the
paths a tracker uses most, and made that an acceptance criterion
(D17 and D21).
This page shows where it is, and where it is not. The numbers are the fair comparison of
17 November 2026 and the reruns of 18 November; every value is the median of the repetitions in
the raw results under bench/results/,
and each chart has its exact numbers in a Data block below it. Click a chart to open it on its
own, where hovering a mark shows its value.
The short version
Each bar is moraine's median divided by the better of Lance and Delta Lake on the same measure, with moraine in its current default configuration. Right of 1× moraine is ahead (a solid bar); left of it, behind (an outlined bar).
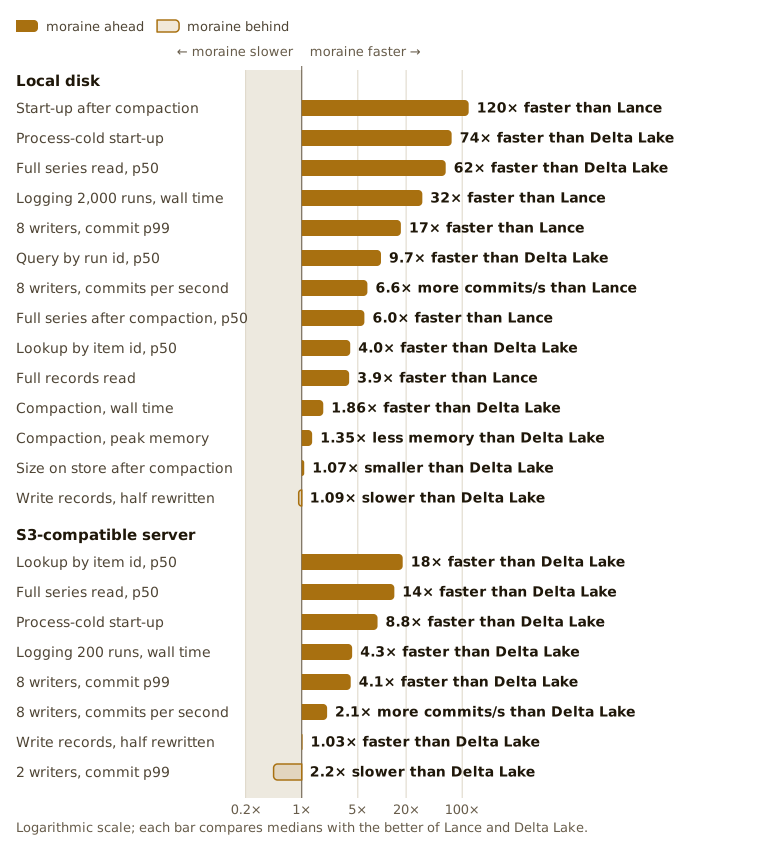
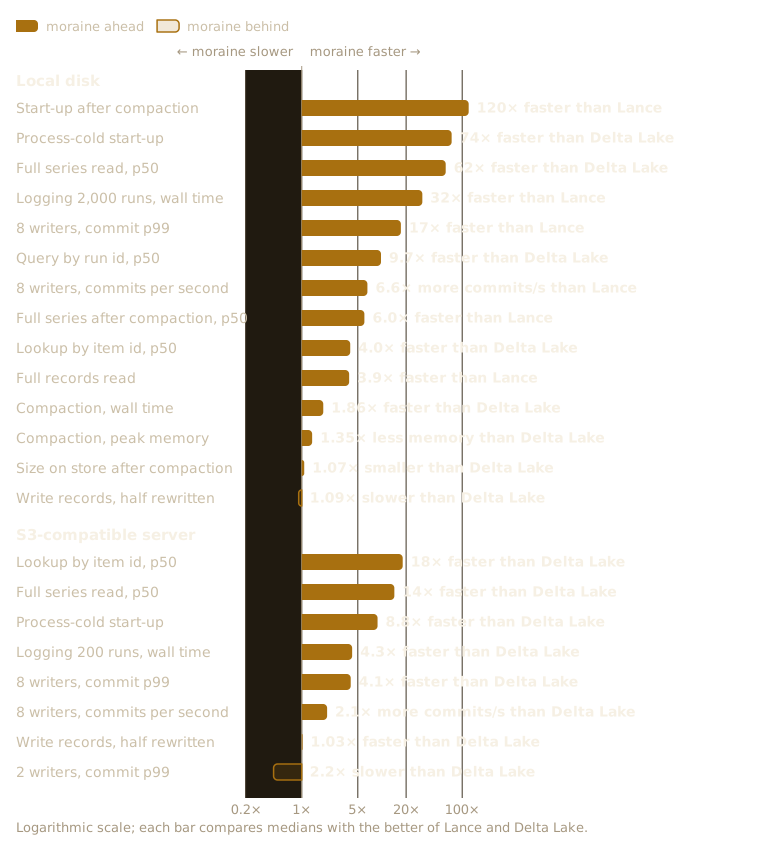
moraine is ahead on most measures, by one to two orders of magnitude on start-up, logging and series reads. It loses two:
- Writing records, where Delta Lake's append is faster (it defers finding the rewritten keys to its reads; moraine's upsert finds them at write time).
- Commit p99 with two writers on S3, where Delta Lake's tail is shorter.
Compaction time is on the chart since 19 November, when I timed the streaming merge, now the default, against Delta Lake in one run on a quiet host (Compaction).
Part of the logging lead is not the engine: Lance and Delta Lake run through kv0, a tracker of mine with a write-ahead log and statistics rows that moraine's adapter does not have, so read the logging ratios as an upper bound. Method lists every difference, and the exact numbers behind every bar are in the Data blocks of the next two sections.
Tracker workloads, local disk
One chart per workload, each with its own axis, because the workloads run from a fraction of a millisecond to minutes. 2,000 runs of 2,400 points and 1,000,000 records; five repetitions, or three where a workload was rerun on 18 November.
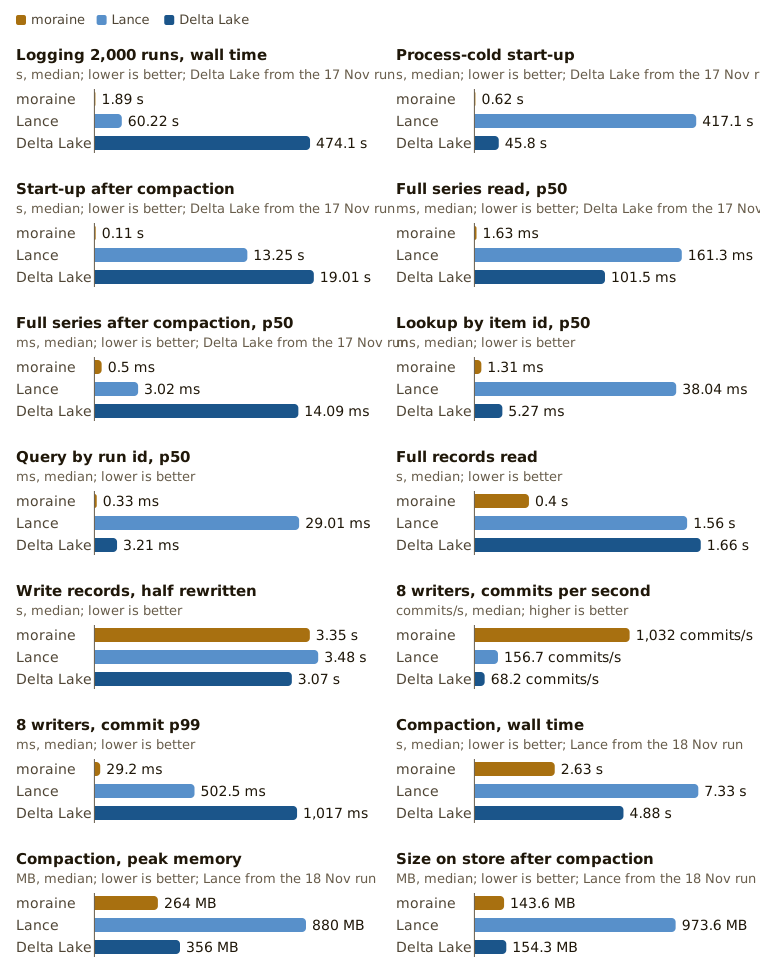
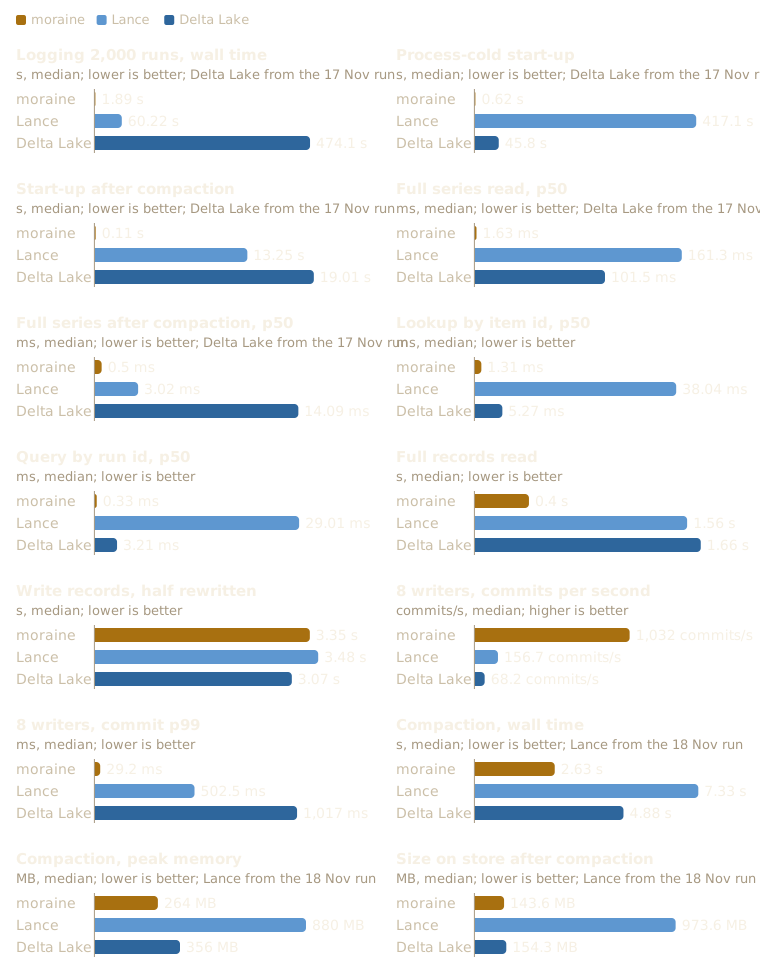
Start-up and logging are where the layout and the commit path pay off: Lance reads 14.9 GB through thousands of small fragments to start when nothing compacts in the background. After compaction moraine reads a full series in 0.5 ms against Lance's 3.0 ms; before it, in kv0's layout, it is ahead of both as well. The one loss on local disk is the records write: 3.35 s against Delta Lake's 3.07 s.
Data
Medians, with the range of the repetitions in brackets; the run each value comes from is in the last column.
| Measure | moraine | Lance | Delta Lake | moraine against the better | Run |
|---|---|---|---|---|---|
| Logging 2,000 runs, wall time | 1.89 s (1.87–1.89) | 60.22 s (58.25–61.79) | 474.1 s (472.4–474.8) | 32× faster than Lance | moraine, Lance: 18 Nov, rerun-local; Delta Lake: 17 Nov, fair-local |
| Process-cold start-up | 0.62 s (0.61–0.63) | 417.1 s (395.4–421.1) | 45.8 s (39.59–55.4) | 74× faster than Delta Lake | moraine, Lance: 18 Nov, rerun-local; Delta Lake: 17 Nov, fair-local |
| Start-up after compaction | 0.11 s (0.11–0.12) | 13.25 s (8.26–14.45) | 19.01 s (18.07–20.75) | 120× faster than Lance | moraine, Lance: 18 Nov, rerun-local; Delta Lake: 17 Nov, fair-local |
| Full series read, p50 | 1.63 ms (1.54–1.92) | 161.3 ms (129.6–170.2) | 101.5 ms (84.47–115) | 62× faster than Delta Lake | moraine, Lance: 18 Nov, rerun-local; Delta Lake: 17 Nov, fair-local |
| Full series after compaction, p50 | 0.5 ms (0.3–0.56) | 3.02 ms (1.97–4.03) | 14.09 ms (10.55–19.81) | 6.0× faster than Lance | moraine, Lance: 18 Nov, rerun-local; Delta Lake: 17 Nov, fair-local |
| Lookup by item id, p50 | 1.31 ms (1.29–3.35) | 38.04 ms (24.25–45.88) | 5.27 ms (3.95–6.22) | 4.0× faster than Delta Lake | 17 Nov, 5 runs |
| Query by run id, p50 | 0.33 ms (0.23–0.68) | 29.01 ms (26.7–30.65) | 3.21 ms (2.92–3.88) | 9.7× faster than Delta Lake | 17 Nov, 5 runs |
| Full records read | 0.4 s (0.38–0.4) | 1.56 s (1.48–1.61) | 1.66 s (1.52–1.72) | 3.9× faster than Lance | 17 Nov, 5 runs |
| Write records, half rewritten | 3.35 s (3.32–3.37) | 3.48 s (3.34–4.39) | 3.07 s (2.92–3.31) | 1.09× slower than Delta Lake | 17 Nov, 5 runs |
| 8 writers, commits per second | 1,032 commits/s (961.4–1,268) | 156.7 commits/s (96.1–305.1) | 68.2 commits/s (64.7–83.3) | 6.6× more commits/s than Lance | 17 Nov, 5 runs |
| 8 writers, commit p99 | 29.2 ms (22.1–73.4) | 502.5 ms (254.2–559.2) | 1,017 ms (911.3–1,179) | 17× faster than Lance | 17 Nov, 5 runs |
| Compaction, wall time | 2.63 s (2.59–2.69) | 7.33 s (7.17–7.43) | 4.88 s (4.7–5.33) | 1.86× faster than Delta Lake | moraine, Delta Lake: 19 Nov, local-compaction-quiet; Lance: 18 Nov, rerun-local |
| Compaction, peak memory | 264 MB (262–267) | 880 MB (798–901) | 356 MB (344–381) | 1.35× less memory than Delta Lake | moraine, Delta Lake: 19 Nov, local-compaction-quiet; Lance: 18 Nov, rerun-local |
| Size on store after compaction | 143.6 MB | 973.6 MB | 154.3 MB (154.2–154.3) | 1.07× smaller than Delta Lake | moraine, Delta Lake: 19 Nov, local-compaction-quiet; Lance: 18 Nov, rerun-local |
Raw results: 2026-11-17-fair-local.jsonl, 2026-11-18-rerun-local.jsonl, 2026-11-19-local-compaction-quiet.jsonl.
Tracker workloads, S3-compatible server
RustFS in Docker, 200 runs and 100,000 records, three repetitions. On S3 the fixed costs are round trips, so fewer requests is most of the story: a logged run costs moraine 8 requests against 16.4 for Lance and 36.7 for Delta Lake.
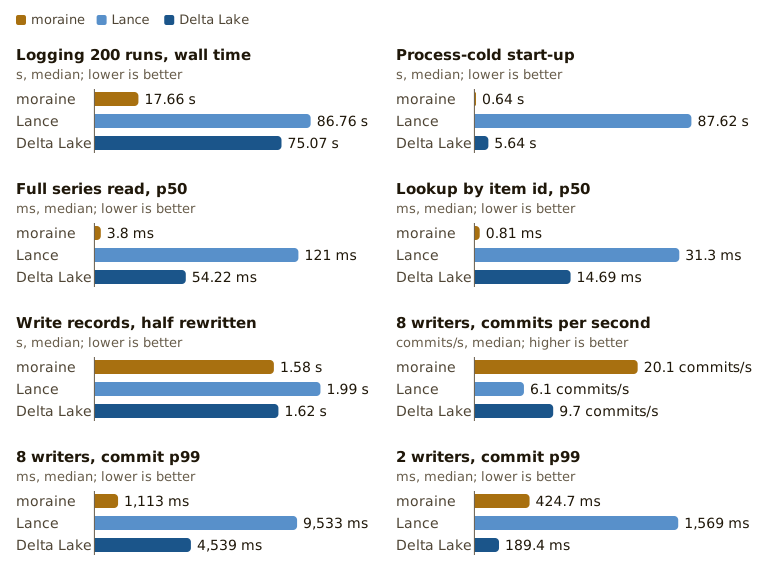
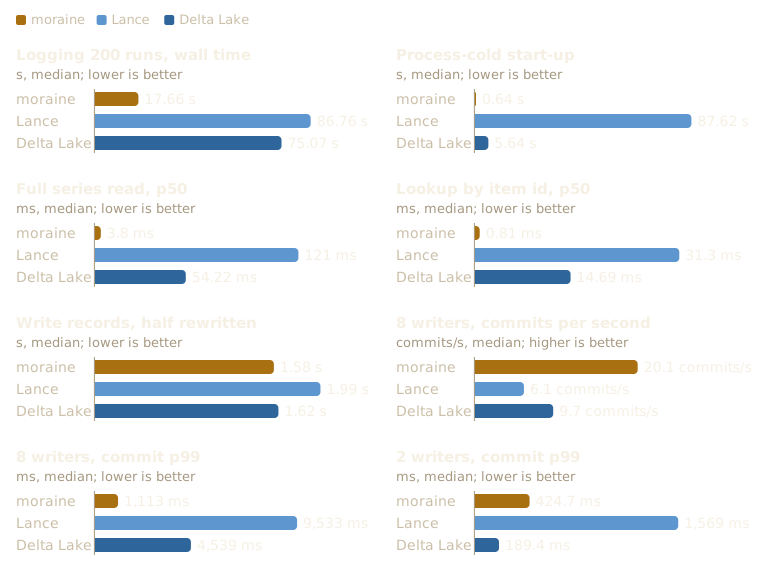
The records write is level with Delta Lake (1.58 s against 1.62 s). The one clear loss is the commit p99 at two writers, 424.7 ms against Delta Lake's 189.4 ms; from four writers on moraine's tail is the shortest of the three.
Data
Medians, with the range of the repetitions in brackets; the run each value comes from is in the last column.
| Measure | moraine | Lance | Delta Lake | moraine against the better | Run |
|---|---|---|---|---|---|
| Logging 200 runs, wall time | 17.66 s (14.36–20.93) | 86.76 s (73.51–86.98) | 75.07 s (57.98–78.31) | 4.3× faster than Delta Lake | 17 Nov, 3 runs |
| Process-cold start-up | 0.64 s (0.47–0.82) | 87.62 s (40.82–112.9) | 5.64 s (2.32–6.62) | 8.8× faster than Delta Lake | 17 Nov, 3 runs |
| Full series read, p50 | 3.8 ms (3.13–7.14) | 121 ms (78.32–160.6) | 54.22 ms (26.55–58.16) | 14× faster than Delta Lake | 17 Nov, 3 runs |
| Lookup by item id, p50 | 0.81 ms (0.62–1.37) | 31.3 ms (11.17–32.04) | 14.69 ms (7.95–17.05) | 18× faster than Delta Lake | 17 Nov, 3 runs |
| Write records, half rewritten | 1.58 s (1.45–6.48) | 1.99 s (1.62–2.05) | 1.62 s (1.57–2.72) | 1.03× faster than Delta Lake | 17 Nov, 3 runs |
| 8 writers, commits per second | 20.1 commits/s (15.3–20.8) | 6.1 commits/s (4.8–6.3) | 9.7 commits/s (9.4–9.7) | 2.1× more commits/s than Delta Lake | 18 Nov, 3 runs |
| 8 writers, commit p99 | 1,113 ms (1,038–1,373) | 9,533 ms (6,802–10,639) | 4,539 ms (3,341–4,821) | 4.1× faster than Delta Lake | 18 Nov, 3 runs |
| 2 writers, commit p99 | 424.7 ms (422–430.3) | 1,569 ms (1,096–2,187) | 189.4 ms (109.5–238.5) | 2.2× slower than Delta Lake | 17 Nov, 3 runs |
Raw results: 2026-11-17-fair-s3.jsonl, 2026-11-18-rerun-s3-multi-writer.jsonl.
Many writers
Every writer appends to the same table at once, at 2, 4, 8 and 16 writers. Both axes are logarithmic so all three engines stay readable.
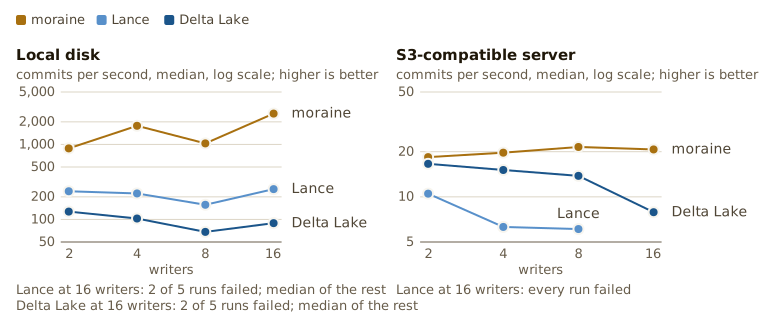
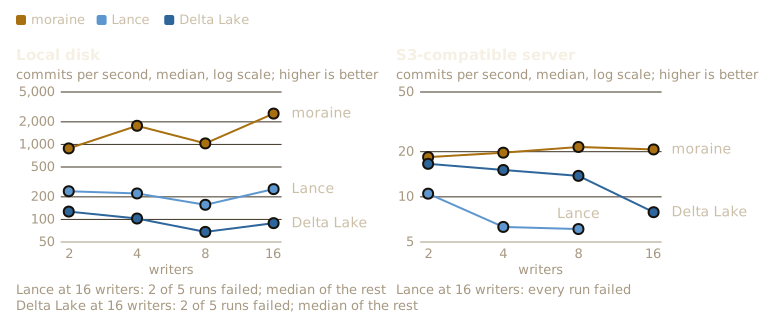
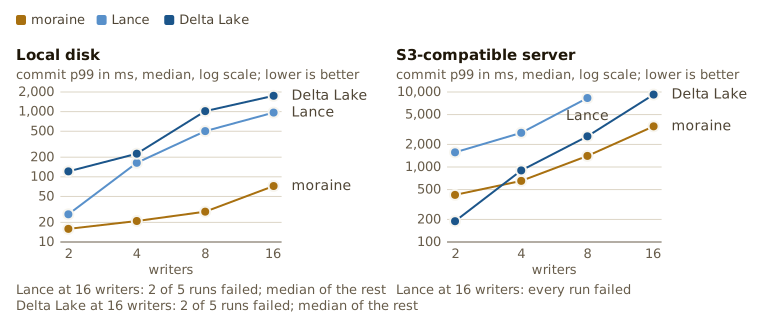
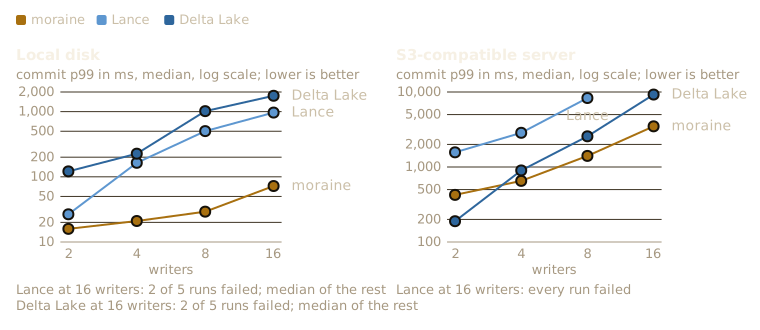
moraine's commit rate does not collapse as writers are added, and it kept every row exactly once in every run. At 16 writers Lance and Delta Lake each lost a writer in two of five local runs, and Lance failed every 16-writer run on S3. On S3 moraine's rate stays flat at about 20 commits a second, so its p99 grows with the queue: a commit waits roughly writers divided by rate. The local runs last 0.1 to 0.4 s, so their rates vary by up to a factor of two between repetitions.
Data
Local disk, 17 Nov run.
| moraine | Lance | Delta Lake | |
|---|---|---|---|
| 2 writers, commits per second | 885.4 (721.1–1,882) | 237.4 (47.9–632.5) | 127.2 (121–159) |
| 2 writers, commit p99 | 15.9 ms (6.3–23.8) | 26.6 ms (10.8–250.4) | 121.2 ms (65.7–167.2) |
| 4 writers, commits per second | 1,772 (1,503–2,857) | 222 (20.8–270.2) | 102.8 (98.5–106) |
| 4 writers, commit p99 | 21 ms (7.8–25.7) | 164 ms (158–912.9) | 226.3 ms (141.7–362.5) |
| 8 writers, commits per second | 1,032 (961.4–1,268) | 156.7 (96.1–305.1) | 68.2 (64.7–83.3) |
| 8 writers, commit p99 | 29.2 ms (22.1–73.4) | 502.5 ms (254.2–559.2) | 1,017 ms (911.3–1,179) |
| 16 writers, commits per second | 2,577 (2,107–2,716) | 253.5 (152.4–313.5), failed in 2 of 5 runs | 89.2 (85.4–89.3), failed in 2 of 5 runs |
| 16 writers, commit p99 | 72.2 ms (48.9–131.1) | 967 ms (836–1,113), failed in 2 of 5 runs | 1,750 ms (1,672–1,768), failed in 2 of 5 runs |
S3-compatible server, 17 Nov run.
| moraine | Lance | Delta Lake | |
|---|---|---|---|
| 2 writers, commits per second | 18.4 (17.8–20.4) | 10.5 (10–13.2) | 16.6 (15.1–25.2) |
| 2 writers, commit p99 | 424.7 ms (422–430.3) | 1,569 ms (1,096–2,187) | 189.4 ms (109.5–238.5) |
| 4 writers, commits per second | 19.7 (11.1–23.9) | 6.3 (4.9–8.4) | 15.1 (13.8–23.9) |
| 4 writers, commit p99 | 653 ms (559.8–2,743) | 2,858 ms (2,359–3,659) | 899.9 ms (463.8–942.3) |
| 8 writers, commits per second | 21.5 (21.3–23.4) | 6.1 (5.6–7) | 13.8 (10.1–20.8) |
| 8 writers, commit p99 | 1,405 ms (1,233–1,578) | 8,313 ms (7,568–8,377) | 2,566 ms (1,640–2,711) |
| 16 writers, commits per second | 20.7 (18.4–23.6) | failed in 3 of 3 runs | 7.9 (7.1–11.4) |
| 16 writers, commit p99 | 3,485 ms (2,094–3,593) | failed in 3 of 3 runs | 9,243 ms (8,750–10,689) |
Raw results: 2026-11-17-fair-local.jsonl, 2026-11-17-fair-s3.jsonl.
Compaction
Compaction of the tracker tables on local disk: time and peak memory, as two charts.
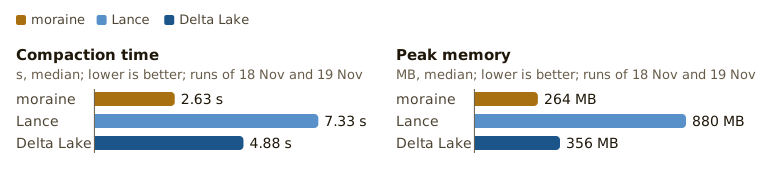
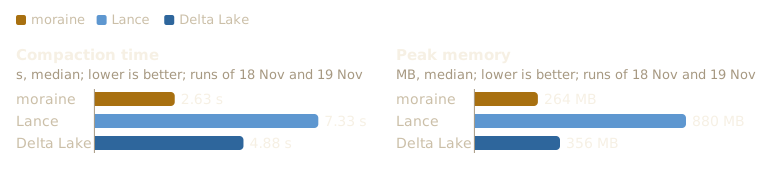
The streaming merge, moraine's default, takes 2.63 s against Delta Lake's 4.88 s and peaks at 264 MB against Delta Lake's 356 MB, both measured in one run of three repetitions with the engines interleaved, on 19 November at a 1-minute load of 2 on 20 cores, with a build from before D65 and D68 changed compaction's commit; I will re-measure it with them. Lance's figures are from 18 November. The in-memory merge's own figures, which it no longer represents, are in the Data block.
Data
| Compaction of the tracker tables | moraine | Lance | Delta Lake |
|---|---|---|---|
| Wall time | 2.63 s (2.59–2.69), 19 Nov | 7.33 s (7.17–7.43), 18 Nov | 4.88 s (4.7–5.33), 19 Nov |
| Peak memory | 264 MB (262–267), 19 Nov | 880 MB (798–901), 18 Nov | 356 MB (344–381), 19 Nov |
moraine's earlier in-memory merge, no longer the default: wall time 1.98 s (1.97–2.05) (18 Nov); wall time 6.13 s (5.52–6.84) (18 Nov, loaded host); peak memory 753 MB (753–754) (18 Nov); peak memory 754 MB (751–754) (18 Nov, loaded host).
Raw results: 2026-11-18-local-compaction-memory.jsonl, 2026-11-18-rerun-local.jsonl, 2026-11-19-local-compaction-quiet.jsonl.
Vector search
256- and 768-dimension vectors in 64 Gaussian clusters, cosine metric, 1,000 held-out queries, k = 10, searched warm. Each engine is shown at its fastest setting that reaches recall@10 of 0.95; the rows are split into 1, 10 or 100 data files. Lance's IVF-PQ index is one dataset. Analysis: D37 and D54.
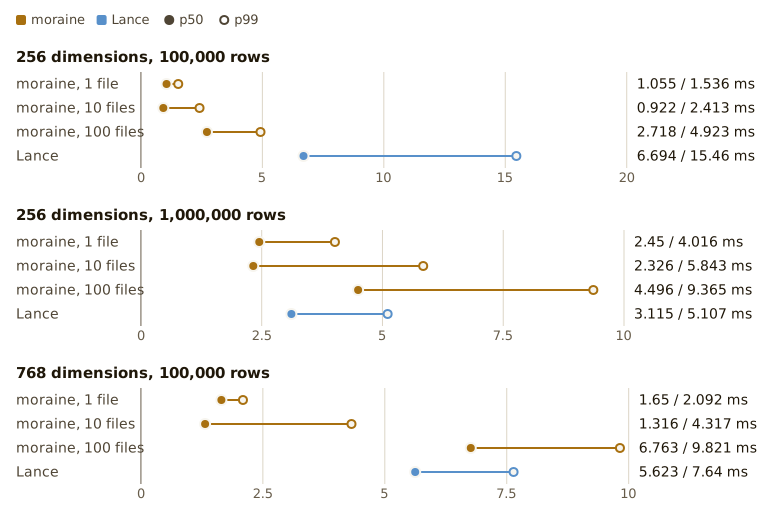
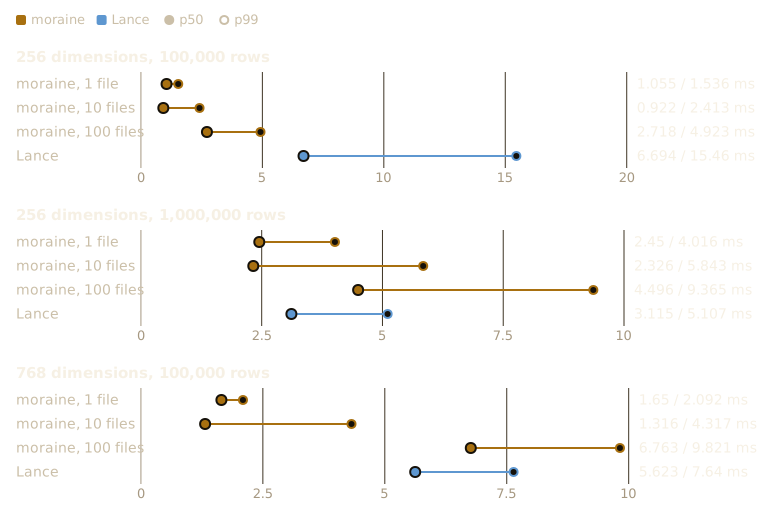
At 100,000 rows of 256 dimensions moraine's usearch index beats Lance on every layout. At a million rows it wins on one file (2.45 ms against 3.1 ms at the median), but on 10 files its p99 and on 100 files both its p50 and p99 are above Lance's. At 768 dimensions it loses on 100 small files. Those are misses I keep as targets rather than loosen.
These runs predate graph builds on several threads and the shared search pool (19 November,
D80
and D83),
so the build times are stale and the latencies will be re-measured. Before-and-after runs of
moraine alone, each pair under the same load, are in
docs/BENCH.md: the builds are 2.4
to 3.5 times faster, and the million-row latencies did not change beyond the noise of a shared
host.
Data
| Data set | Engine and layout | p50 (ms) | p99 (ms) | Recall@10 | Setting | Run |
|---|---|---|---|---|---|---|
| 256 dimensions, 100,000 rows | moraine, 1 file | 1.055 | 1.536 | 0.962 | expansion_search 64 |
17 Nov |
| 256 dimensions, 100,000 rows | moraine, 10 files | 0.922 | 2.413 | 0.9999 | expansion_search 64 |
17 Nov |
| 256 dimensions, 100,000 rows | moraine, 100 files | 2.718 | 4.923 | 1.0 | expansion_search 64 |
17 Nov |
| 256 dimensions, 100,000 rows | Lance | 6.694 | 15.46 | 0.9596 | lance-ivf-pq-sv32, nprobes 20, refine 30 |
17 Nov |
| 256 dimensions, 1,000,000 rows | moraine, 1 file | 2.45 | 4.016 | 0.977 | expansion_search 64 |
18 Nov |
| 256 dimensions, 1,000,000 rows | moraine, 10 files | 2.326 | 5.843 | 0.9805 | expansion_search 64 |
18 Nov |
| 256 dimensions, 1,000,000 rows | moraine, 100 files | 4.496 | 9.365 | 0.9999 | expansion_search 64 |
18 Nov |
| 256 dimensions, 1,000,000 rows | Lance | 3.115 | 5.107 | 0.9583 | lance-ivf-pq-sv64, nprobes 20, refine 10 |
17 Nov |
| 768 dimensions, 100,000 rows | moraine, 1 file | 1.65 | 2.092 | 0.999 | expansion_search 128 |
17 Nov |
| 768 dimensions, 100,000 rows | moraine, 10 files | 1.316 | 4.317 | 0.9999 | expansion_search 64 |
17 Nov |
| 768 dimensions, 100,000 rows | moraine, 100 files | 6.763 | 9.821 | 1.0 | expansion_search 64 |
17 Nov |
| 768 dimensions, 100,000 rows | Lance | 5.623 | 7.64 | 0.9834 | lance-ivf-pq-sv96, nprobes 40, refine 50 |
17 Nov |
Raw results: 2026-11-17-vector.jsonl, 2026-11-18-rerun-vector.jsonl.
Full-text search
Synthetic documents of 20 to 120 Zipf-distributed words, 1,000 queries of one to three words, k = 10, searched warm; moraine's latency includes fetching the hits' rows from Parquet. Every query ranked exactly as one tantivy index over the whole table does, on every layout. Analysis: D46.
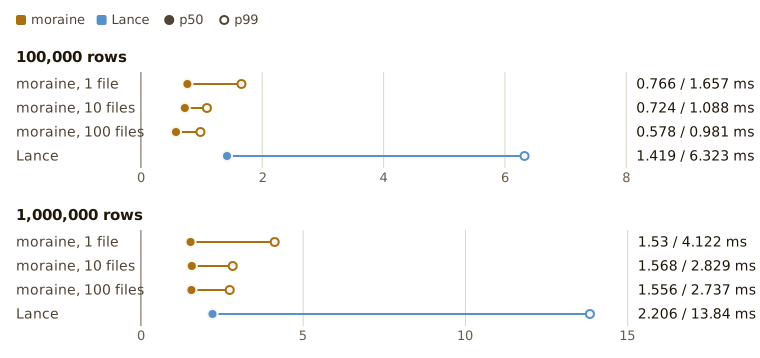
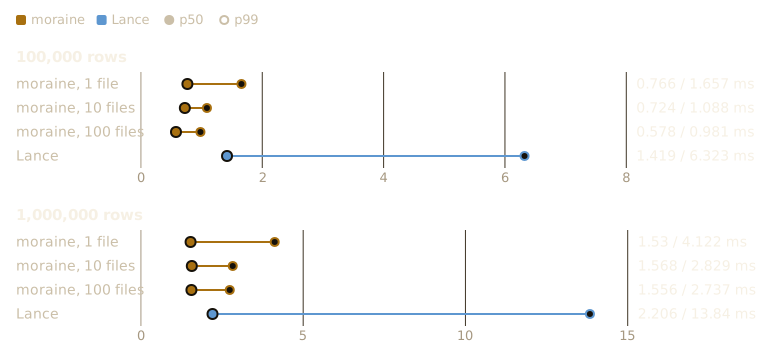
moraine beats Lance at a million rows on every layout, most of all at the tail. At 100,000 rows on one file the comparison depends on the run: Lance measured 1.42 ms in the three-repetition rerun shown here, but 0.75 ms in the earlier full-text run, where moraine's 0.89 ms lost. moraine is also slower at the median than the single merged tantivy index it reproduces (about 0.05 ms at 100,000 rows), because it opens one searcher per file and reads the hits' rows.
Data
| Rows | Engine and layout | p50 (ms) | p99 (ms) | Runs | Run |
|---|---|---|---|---|---|
| 100,000 rows | moraine, 1 file | 0.766 (0.758–0.777) | 1.657 | 3 | 18 Nov |
| 100,000 rows | moraine, 10 files | 0.724 | 1.088 | 1 | 18 Nov |
| 100,000 rows | moraine, 100 files | 0.578 | 0.981 | 1 | 18 Nov |
| 100,000 rows | Lance | 1.419 (0.944–1.648) | 6.323 | 3 | 18 Nov |
| 1,000,000 rows | moraine, 1 file | 1.53 | 4.122 | 1 | 18 Nov |
| 1,000,000 rows | moraine, 10 files | 1.568 | 2.829 | 1 | 18 Nov |
| 1,000,000 rows | moraine, 100 files | 1.556 | 2.737 | 1 | 18 Nov |
| 1,000,000 rows | Lance | 2.206 | 13.84 | 1 | 18 Nov |
Raw results: 2026-11-18-fts.jsonl, 2026-11-18-rerun-fts.jsonl.
Blobs
moraine alone, values from 64 KiB to 64 MiB, written four per append. 64 KiB values stay inline in the rows, which is why they read so fast. Measured on 19 November on a host shared with other work (1-minute load 6 to 10 on 20 cores at the start of each run), so compare these with each other rather than with the sections above.
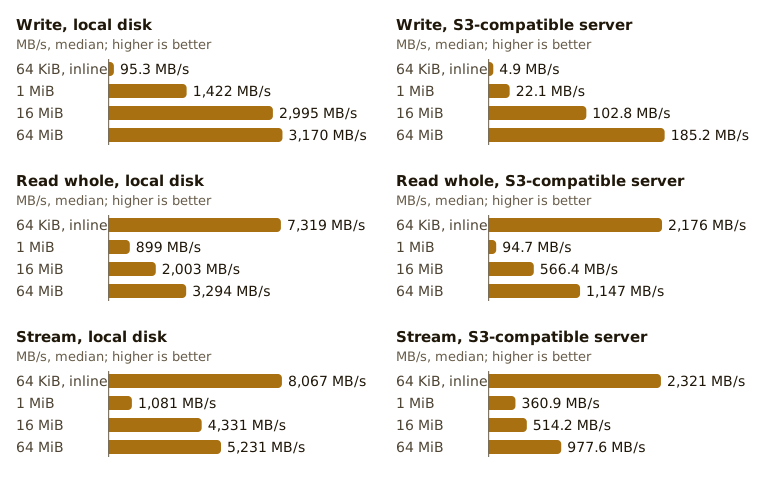
Streams now read 4 MiB ranges, four ahead of the reader, and keep up with whole reads or beat them (external values on local disk: 1.1 to 5.2 GB/s against 0.9 to 3.3 GB/s; the code of whole reads did not change, and their spread is the host's load). A large value's parts now go up four at a time, and 64 MiB values reached 185 MB/s on the S3-compatible server against about 100 MB/s on 18 November, but a pair of runs one after the other under the same load showed no gain from that (107 against 125 MB/s), so I do not count it as one: the server sets that rate. Small external values are still slow there, 22 MB/s at 1 MiB, and that is a loss: the same values PUT straight to the server, four at a time and with no table, reach 36 MB/s, and each append adds its data file and its log entry after the values (D82).
Data
Local disk, 3 runs.
| Value size | Write (MB/s) | Read whole (MB/s) | Stream (MB/s) | 4 KiB range p50 (ms) | Copied reference p50 (ms) |
|---|---|---|---|---|---|
| 64 KiB, inline | 95.3 (85–254.4) | 7,319 (4,603–14,670) | 8,067 (5,103–15,271) | 0 | 1.33 |
| 1 MiB | 1,422 (980.2–2,135) | 899 (612.9–2,496) | 1,081 (804.2–1,981) | 0.076 | 3.87 |
| 16 MiB | 2,995 (2,867–3,107) | 2,003 (1,991–3,190) | 4,331 (3,444–4,625) | 0.059 | 19.43 |
| 64 MiB | 3,170 (3,139–3,291) | 3,294 (3,055–3,340) | 5,231 (4,440–5,580) | 0.018 | 34.14 |
S3-compatible server, 3 runs.
| Value size | Write (MB/s) | Read whole (MB/s) | Stream (MB/s) | 4 KiB range p50 (ms) | Copied reference p50 (ms) |
|---|---|---|---|---|---|
| 64 KiB, inline | 4.9 (4–6.4) | 2,176 (1,739–2,528) | 2,321 (1,897–2,676) | 0.001 | 42.9 |
| 1 MiB | 22.1 (21.8–24.9) | 94.7 (91.4–278) | 360.9 (135.9–361.5) | 5.217 | 101.1 |
| 16 MiB | 102.8 (79.5–128.3) | 566.4 (524.9–569.1) | 514.2 (493.9–570.8) | 5.35 | 236.5 |
| 64 MiB | 185.2 (105.1–206.9) | 1,147 (1,109–1,151) | 977.6 (947.5–1,047) | 2.168 | 728.1 |
Raw results: 2026-11-19-blobs-local.jsonl, 2026-11-19-blobs-s3.jsonl.
Index before commit
How often a vector search has to fall back to an exact scan because a file has no index yet,
under a steady stream of appends on local disk. With the index built before commit the share is
zero for files within the build's limits, as designed. Since graphs build on several threads
(19 November), small files that wait for compaction get their graphs fast enough for a share of
3.3 % at 2,000 rows a second with min_file_age 0, under the 5 % I aimed for; at the default
min_file_age of 60 s it is 28 %, and at 10,000 rows a second 28 %
(D61,
D85).
This one stays a table: several configurations with several measures each are easier to read as
rows.
| Load | Index before commit | Exact share, mean (max) | Pending, max | Append p50 / p99 (ms) |
|---|---|---|---|---|
| 20,000 rows every 2 s, 5 min, 8 steps | on | 0.0 % (0.0 %) | 0 % | 1,265 / 2,380 |
1,000 rows every 0.5 s, 10 min, min_file_age 0, 64 steps |
on | 3.3 % (14.5 %) | 0 % | 4.18 / 9.3 |
| 1,000 rows every 0.5 s, 10 min, 64 steps | on | 28.0 % (100.0 %) | 0 % | 4.26 / 6.86 |
1,000 rows every 0.1 s, 5 min, min_file_age 0, 8 steps |
on | 27.9 % (54.5 %) | 0 % | 3.47 / 11.62 |
Raw results: 2026-11-19-exact-route.jsonl.
Method
All three engines run the same workloads on one machine, release builds only. Lance and Delta Lake
run through kv0 (KV0_ENGINE=lance and KV0_ENGINE=delta); moraine runs through its own tables.
The harness is bench/, a workspace of its
own. For the fair comparison I removed every difference I could find between the two sides:
- Same consistency. moraine checks the log before every query, as kv0 checks for a newer version.
- No background work in the timers. kv0's automatic compaction and cleanup are off in every timed phase; compaction is a phase of its own for every engine.
- Same layout. moraine stores metric points the way kv0 does: a hashed series id, no run id column.
- Same reads. moraine reads every column and parses the JSON, as kv0 returns it; a lookup by item id is a filtered scan for every engine.
- Checked values. Every read is compared with what was written, and the checksums match across engines, so they returned identical points.
- Process-cold phases. Every phase is a fresh process; the operating system's page cache is warm for every engine alike.
- Repetitions. Engines interleaved, five repetitions on local disk and three on S3; the charts show medians, the Data blocks the ranges.
What still differs, and favours moraine on the logging measures: kv0 has a write-ahead log, keeps statistics rows and commits its four tables one after another; moraine's adapter has no write-ahead log, no statistics rows, and commits its tables concurrently. Neither commit is atomic across tables.
moraine's figures always come from its current default configuration: the newest run that
measured it, never a superseded path such as the in-memory merge. Lance and Delta Lake come from
the same run where it has them, and otherwise from their newest run; the charts say so beside the
panel and the Data blocks name the run of every value. The full tables, earlier runs and the targets are in
docs/BENCH.md.
Reproduce
The harness needs a checkout of kv0 next to this repository
(../kv0) and protoc to build Lance.
cd bench
cargo build --release                       # builds kv0 with both engines; needs protoc
BIN=../target/release/moraine-bench

# Local disk: five repetitions, multi-writer at 2, 4, 8 and 16 writers.
$BIN run --backend local --scale full --repeat 5 --mw-writers 2,4,8,16 \
  --workdir /tmp/moraine-bench --out results-local.jsonl

# S3-compatible server (RustFS in Docker), smaller sizes, three repetitions.
../spike/s3-server.sh start && source <(../spike/s3-server.sh env)
$BIN run --backend s3 --scale quick --repeat 3 --mw-writers 2,4,8,16 \
  --workdir /tmp/moraine-bench --out results-s3.jsonl
../spike/s3-server.sh stop

# Vector and full-text search.
$BIN vector-d24 --rows 100000,1000000 --dims 256 --layouts 1,10,100 --queries 1000 \
  --workdir /tmp/moraine-vector --out results-vector.jsonl
$BIN fts --rows 100000 --layouts 1 --queries 1000 --workdir /tmp/moraine-fts --out results-fts.jsonl

cargo clean --release                       # the build is large; delete it afterwards
Copy the result files into bench/results/ with a date prefix and regenerate the charts and the
Data blocks on this page:
uv run --no-project --with fonttools --with brotli python bench/charts/build.py